Xonai Profiling Page
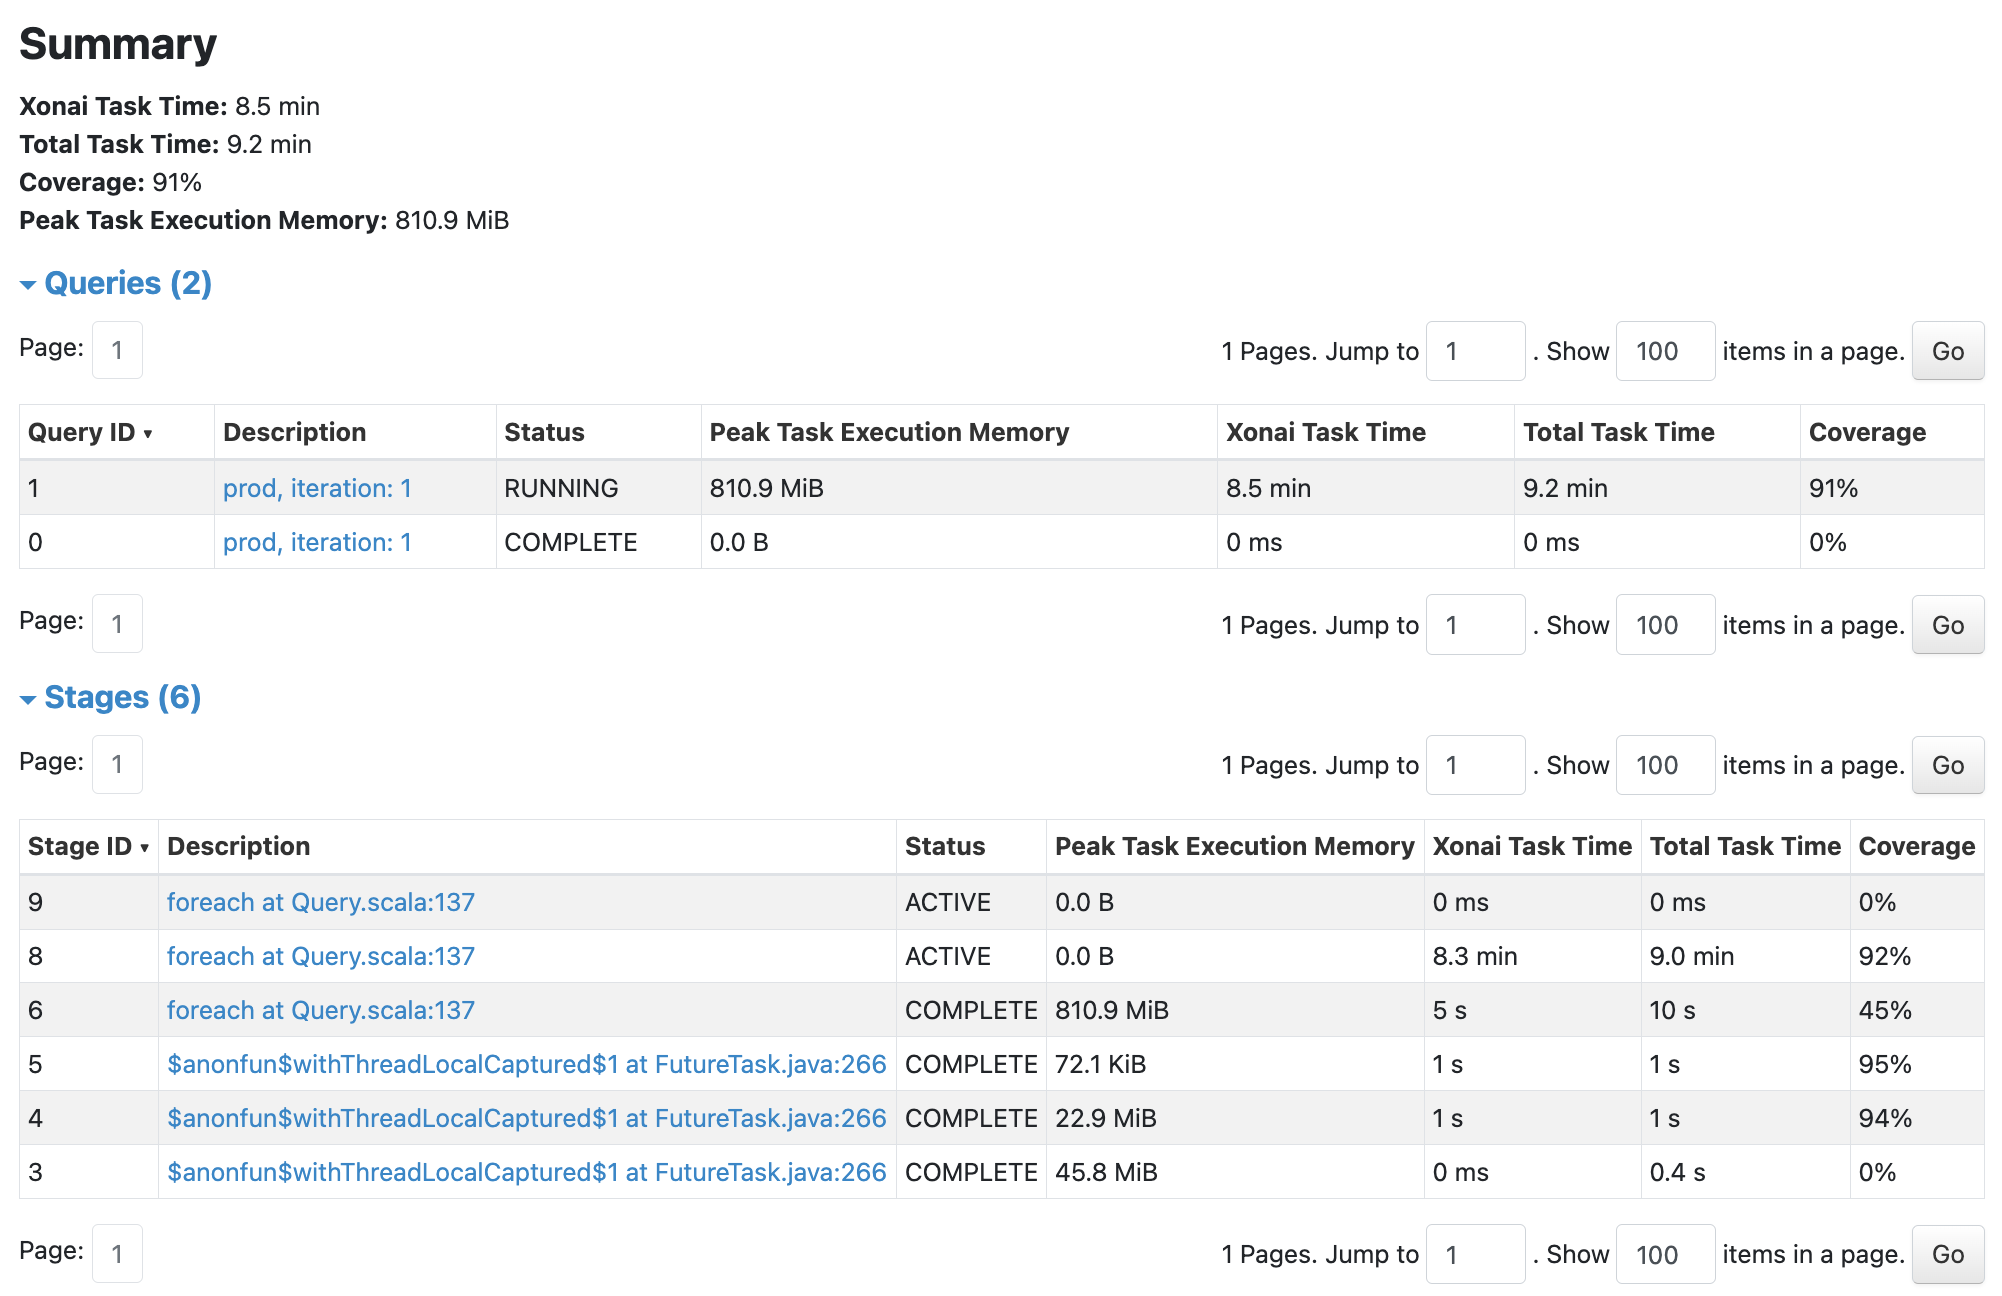
Spark applications running with Xonai will have a new page in the Spark UI that displays memory utilization and execution coverage metrics. This information can be useful to optimize memory configuration and identify bottlenecks.
Attention
In order to see this page in the History Server the Xonai JAR must be in same folder as the Spark JARs.
The description of each metric in the “Stages” section is as follows:
Metric |
Description |
||
|---|---|---|---|
Status |
Execution status of the stage |
||
Peak Task Execution Memory |
Maximum memory allocated by a task in the stage |
||
Xonai Task Time |
Total task execution time (in minutes) spent by Xonai in the stage |
||
Total Task Time |
Total task execution time (in minutes) in the stage |
||
Coverage |
Percentage of the total task execution time spent by Xonai in the stage |
||
The description of each metric in the “Queries” section is as follows:
Metric |
Description |
||
|---|---|---|---|
Status |
Execution status of the query |
||
Peak Task Execution Memory |
Maximum memory allocated by a task in the query |
||
Xonai Task Time |
Total task execution time (in minutes) spent by Xonai in the query |
||
Total Task Time |
Total task execution time (in minutes) in the query |
||
Coverage |
Percentage of the total task execution time spent by Xonai in the query |
||
Remarks
Metrics are collected at a fixed interval (10s by default). While generally this is expected to be enough to give useful estimates of memory usage, it may still be inaccurate as the collection is not guaranteed to happen at true peak usage.
Additionally, not all operations in a Stage report memory usage to the Spark MemoryManager.
The property spark.executor.metrics.pollingInterval can be changed (in milliseconds) to a smaller value to decrease the collection interval and (likely) increase accuracy. Performance may be affected if the collection happens in very small intervals.